Analytics Sandbox Data Analysis Explorations
The data analysis explorations below highlight some of the ways NYSDOT is combining diverse data from the data lake to help address complex transportation issues. Potential use cases include multimodal analysis, asset inventory management, incident analysis, bike/pedestrian safety, ADA accessibility, equity, bike/pedestrian patterns, freight patterns, and program outreach. Click on an analysis exploration to see the detailed analysis.
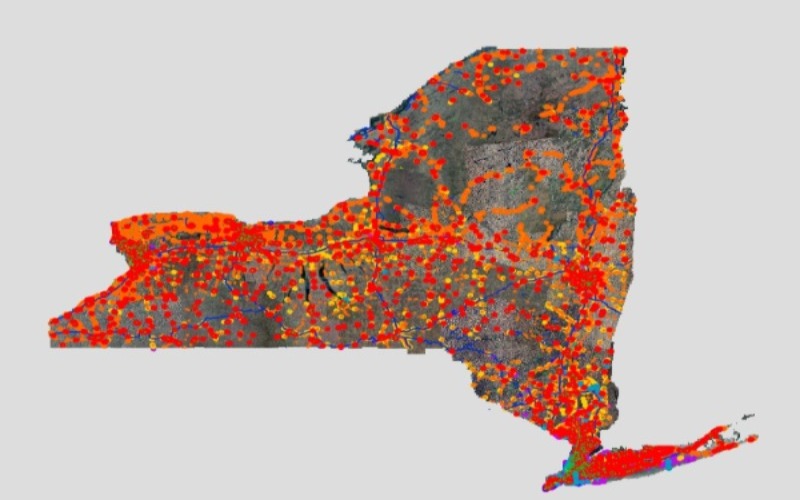
OSM Asset Comparison
Analysis showcasing differences in transporation assets between OpenStreetMap (OSM) and NYSDOT's transportation asset inventory.

Corridor Determination for Signal Timing
Analysis of potential LRS segments for LRS corridor / segment traffic signal timing changes or better coordination.
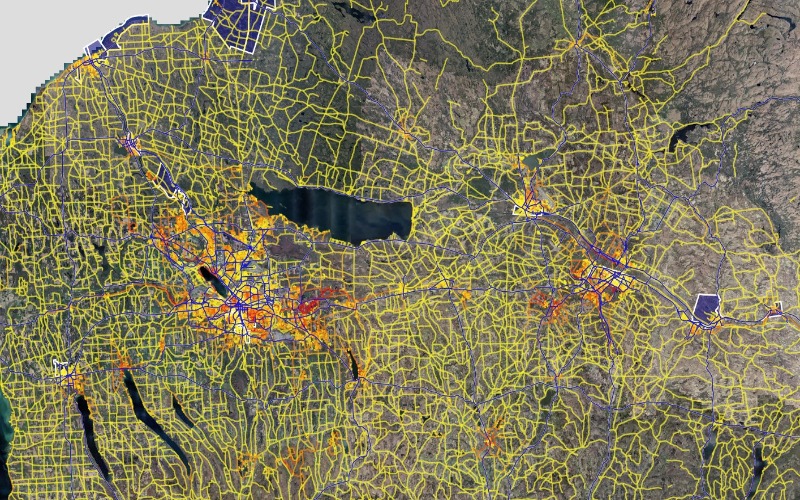
Pedestrian & Bicyclist Safety
Data of accidents involving pedestrians or bicyclists overlaid on arterials and ramps and data of pedestrians and bicyclists travel patterns.
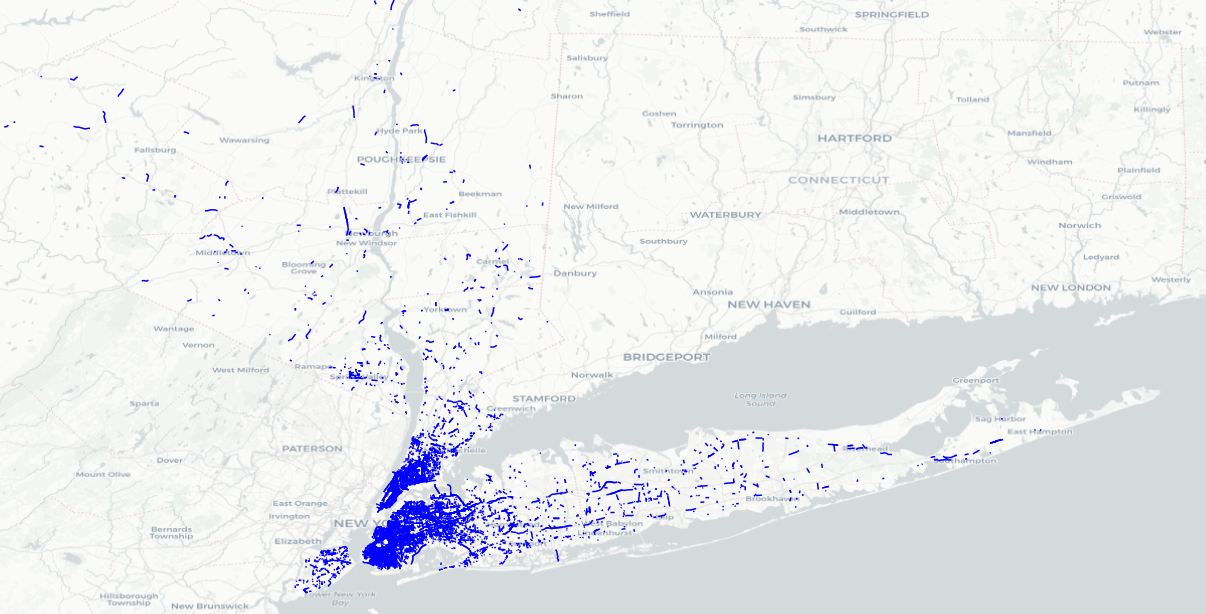
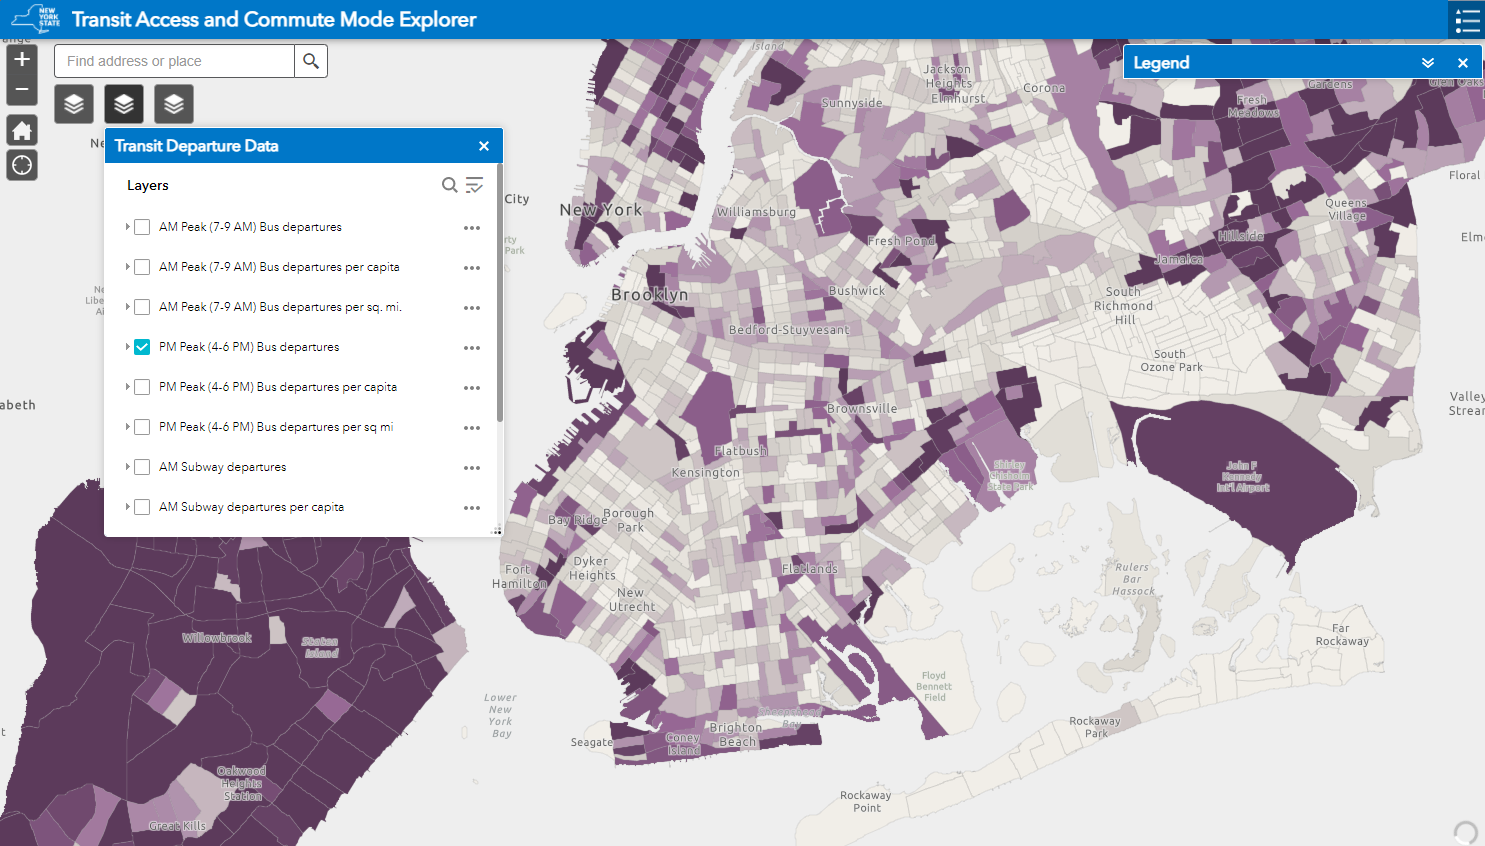
Transit Access and Commute Mode
Explore intersections of datasets relevant to an individual's chosen method and time of commute.
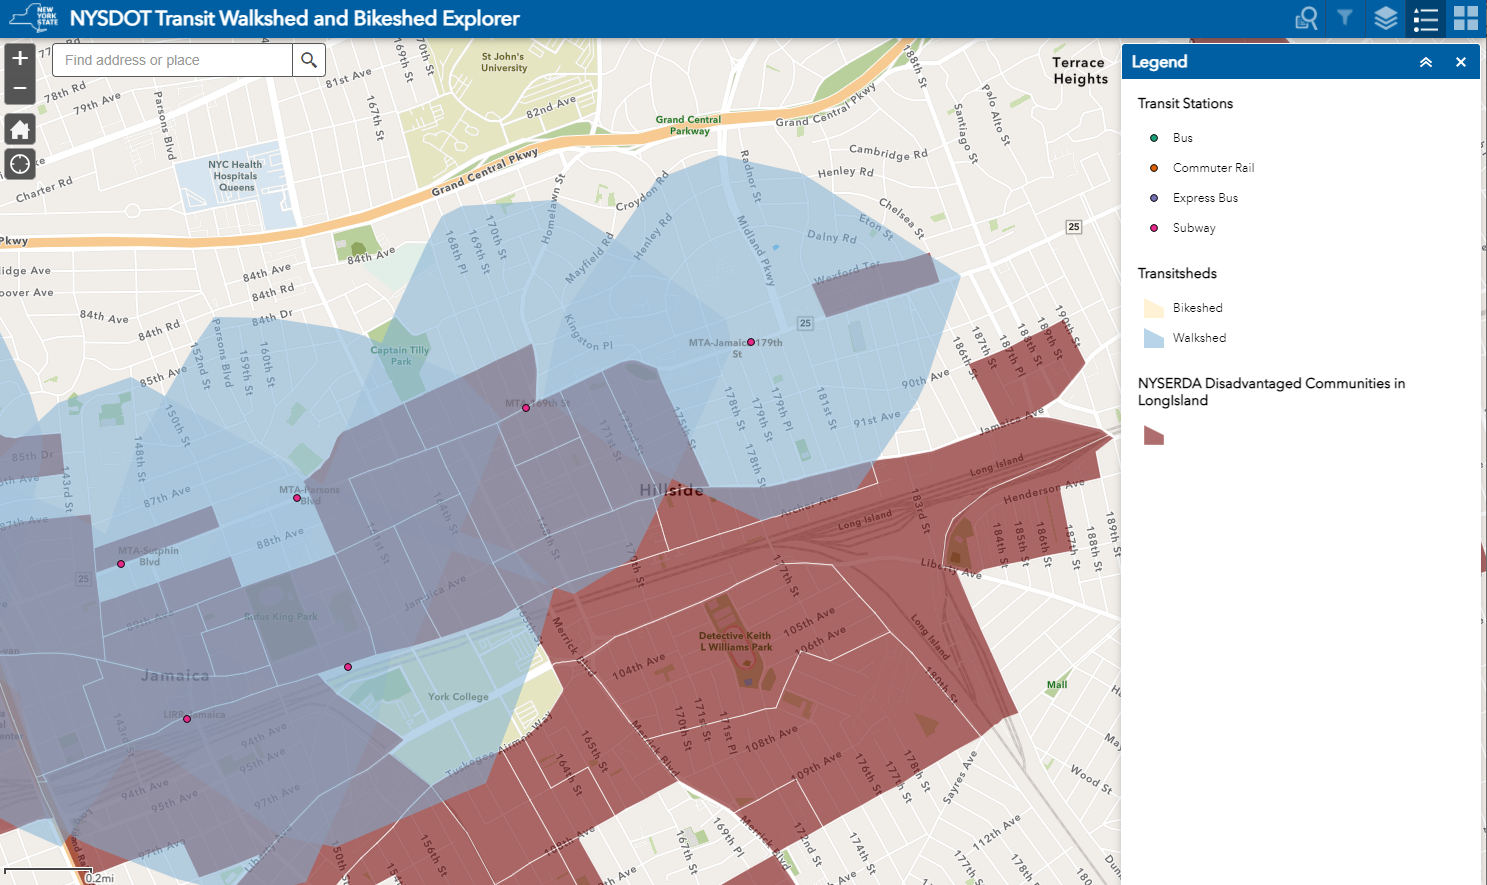
Transit Walk and Bike Sheds
Identify areas within walkable and bike-able distances from existing transit nodes.
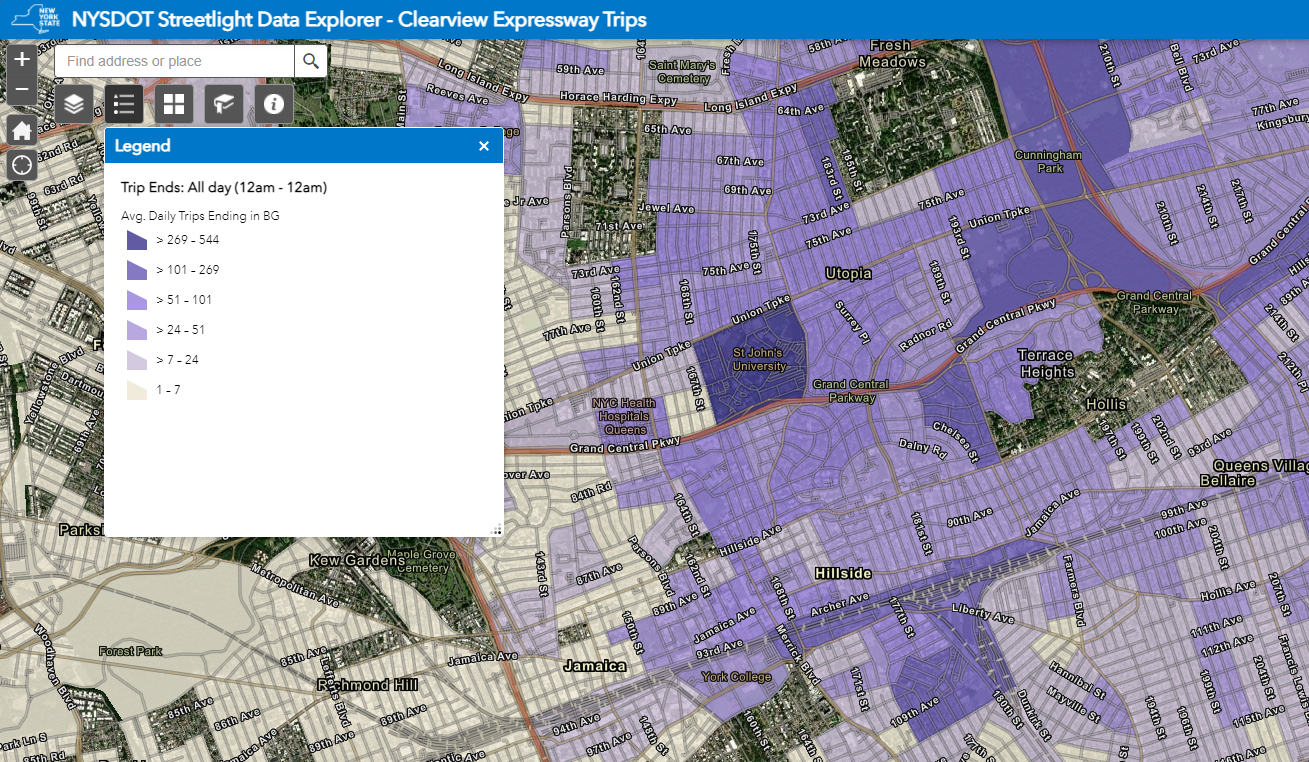
Bottleneck Analysis with LBS Data
Understand trip origins and destinations for devices traveling through the Clearview Expressway.
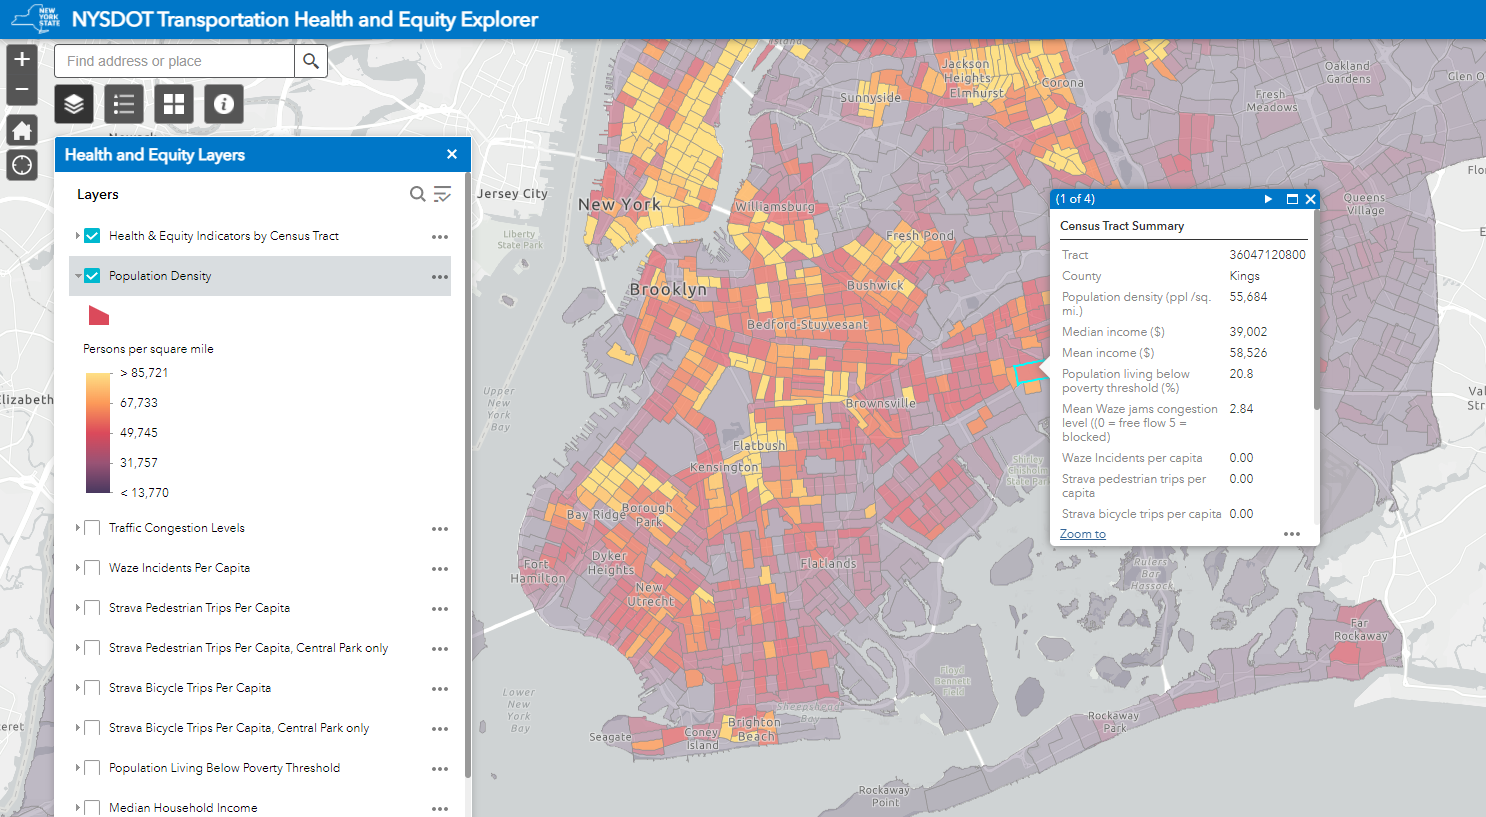
Transportation Health and Mobility Access
Explore factors that influence an individual's respiratory health and physical activity.
